One dimensional frequency tables, which can be created using SPSS, provide the single distribution of the values of any single variable. They are the simplest tool to describe data.
Let's learn how we can use these tables to answer particular questions.
In the national sample, how many experts considered the following statement completely false: In my country, the amount of taxes is NOT a burden for new and growing firms?
To answer this question we must identify the variable which represents this statement. Looking at the variables sheet we quickly identify it in the list: NES15_B05_9
Open the Analyze Menu, select Descriptive Statistics and then Frequency Tables.
In the window that appears, right-click in the list of variables and select the option to see the names of the variables instead of their labels. Move NES15_B05_9 into the variable window and click Accept.
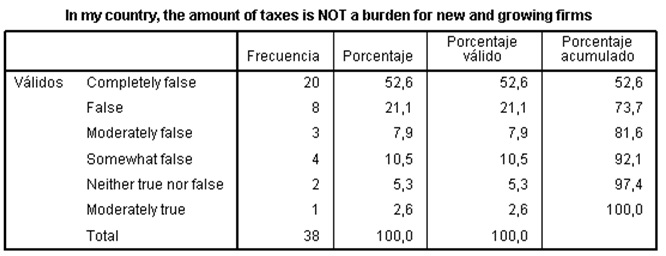
The first column shows the values collected. The second column is the number of times or frequency in which each value was chosen by experts. The third column offers the % or statistical distribution. The fourth column recalculates the distribution over the valid cases. Since all cases here are valid, this column matches the previous one. The last column (always based on the valid %) provides the cumulated distribution, obtained by adding to the first % the second, and so on until getting 100%.
Referring back to the original question, the Frequency column shows that 20 experts out of a sample of 38 (52.6%) considered this statement to be completely false.
From the final column, we can see that 92.1% of the experts considered the statement to be in some way false - indicating that, in this country, taxes are indeed a burden for new and growing firms.
What percentage of experts considered to be true to some extent the statement: In my country, new and growing firms can easily enter new markets?
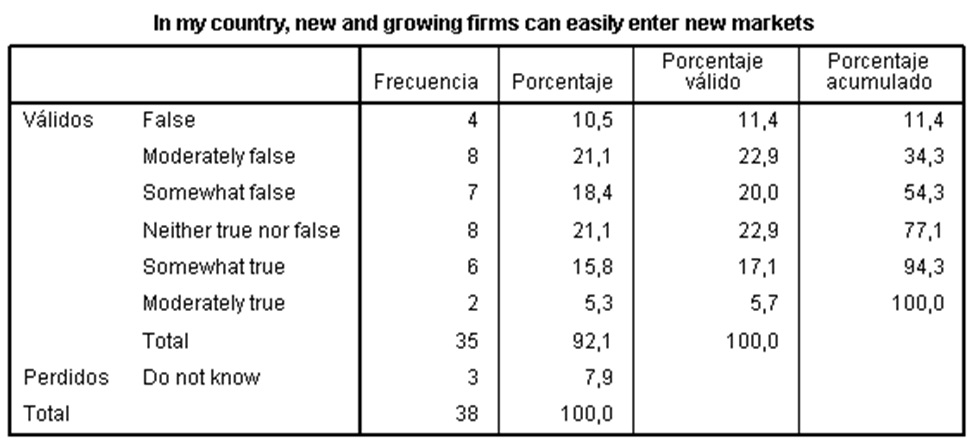
The answer to this question is 17.1% + 5.7% = 22.8% as we do not consider the missing responses and because we must add all responses over the middle point (neither true nor false). Looking at the total distribution we see that 7.9% of experts could not asses this item.
What percentage of experts considered neither true nor false the statement: In my country, new and growing firms can afford the latest technology?
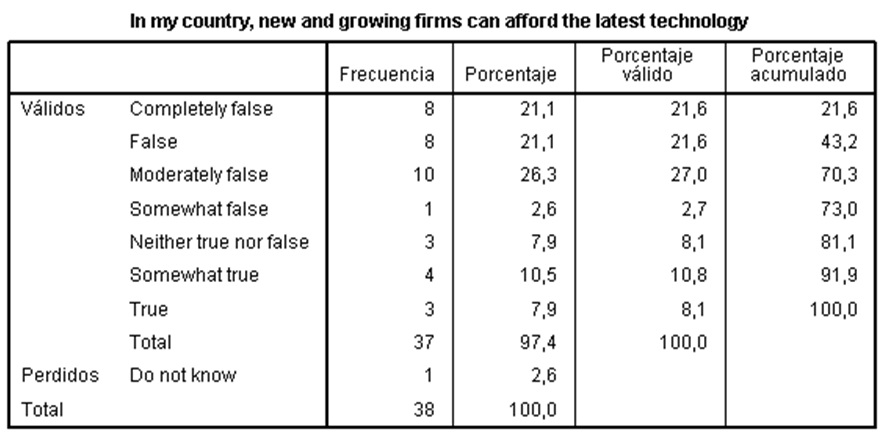
The answer to this question is 8.1% as we do not consider the missing responses in GEM. Here again, it is interesting to look at the total distribution and see that 2.6% of experts did not know how to assess this item.