Increasing female entrepreneurship is essential to achieving sustainable global growth according to organizations such as the World Bank and IMF. Christine Lagarde, Managing Director of the IMF, recently stated:
by bringing more women into the fold, the economy can benefit from their talents, skills, unique perspectives and ideas. This diversity should boost productivity, and lead to higher wages for all.
Academics and policy makers have proposed numerous policies for achieving this goal, including eliminating restrictive gender laws, increasing female educational attainment rates and being more proactive in funding female entrepreneurs.
GEM National Teams also participate in this effort by collecting annual survey data and calculating how female entrepreneurs compare to men. After the data is analyzed, teams calculate their economy’s Female/Male TEA (total early-stage entrepreneurship) ratio, which provides a broad gauge of what percentage of their female adult population is trying to start a new business.
Specifically, this is calculated by determining the percentage of an economy’s 18-64 female population who are either a nascent entrepreneur (actively planning a new business) or owner-manager of a new business (within the first 42 months of starting), divided by the equivalent percentage of their male counterparts.
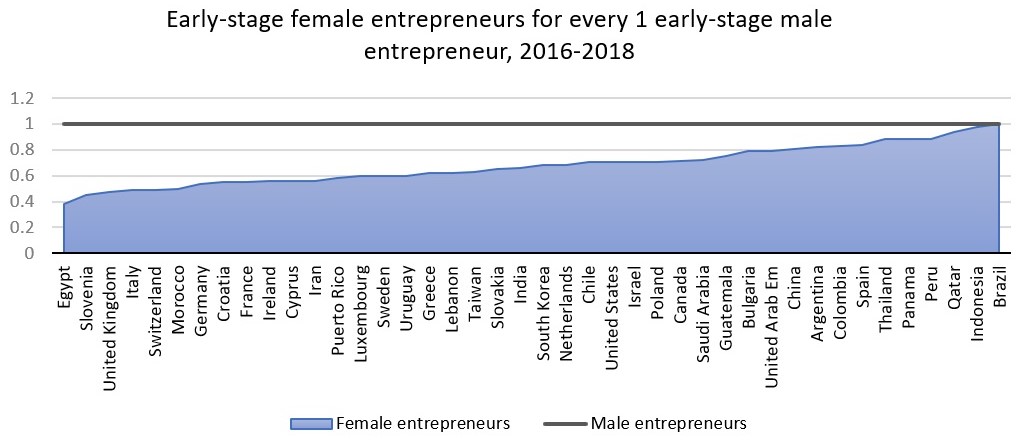
Below is a chart of the 42 economies that participated in all three GEM survey cycles from 2016 to 2018, graphed by their average Female/Male TEA ratio over those three years. It should be read as how many early-stage female entrepreneurs exist in each economy for every 1 early-stage male entrepreneur.


The ratios above can serve as a snapshot depicting the participation gap between their economy’s early-stage male and female entrepreneurs. As discussed in previous posts however, TEA rates alone do not always tell the entire story. This is because TEA rates do not distinguish between necessity-driven entrepreneurs who have no other choice for work versus improvement-driven entrepreneurs who identified a positive business opportunity.
This is a critical distinction as higher improvement-driven entrepreneurship rates indicate a healthier overall economy where people who do not want to become entrepreneurs can find a good job while those who want to take a risk do so for reasons of increasing income or becoming independent.
GEM calculates improvement-driven ratio for early-stage female entrepreneurs; the Female/Male Opportunity-Driven TEA ratio. It is defined as the percentage of those females involved in TEA who (i) claim to be driven by opportunity as opposed to finding no other option for work; and (ii) who indicate the main driver for being involved in this opportunity is being independent or increasing their income, rather than just maintaining their income, divided by the equivalent percentage for their male counterparts.
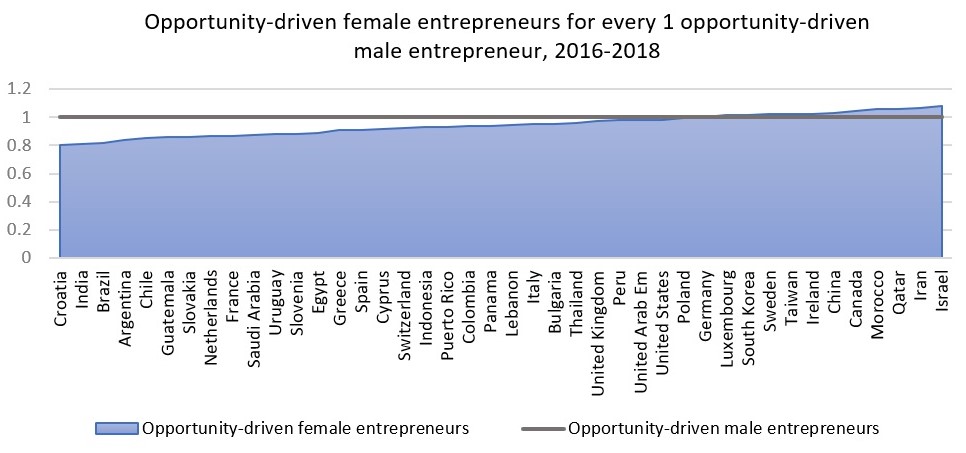
Below is a chart of the 42 economies that participated in all three GEM survey cycles from 2016 to 2018, graphed by their average Female/Male Opportunity-Driven TEA ratio over those three years. It should be read as how many early-stage opportunity-driven female entrepreneurs exist for every 1 early-stage opportunity-driven male entrepreneur.


A positive interpretation of the ratios above is that at least 12 economies have as many or more females driven by opportunity than males. Conversely, 30 countries still lack gender parity in this category of entrepreneurship. With the context of the first graph of overall rates of female/male entrepreneurs, this means that in many economies, there are both fewer female entrepreneurs and that they are less likely to be motivated by positive business opportunities.
While this suggests that many economies are not enabling female entrepreneurs to pursue opportunities at a rate similar to men, there are some positive stories. Below are 10 countries that have improved their Female/Male Opportunity-Driven TEA ratio every year from 2016-2018:
| Average year over year improvement | Female / Male Opportunity Driven TEA | ||||||||||||||||||||||||||||
|---|---|---|---|---|---|---|---|---|---|---|---|---|---|---|---|---|---|---|---|---|---|---|---|---|---|---|---|---|---|
| Canada | 8.0% | 1.047 | |||||||||||||||||||||||||||
| Colombia | 2.0% | 0.937 | |||||||||||||||||||||||||||
| Ireland | 1.5% | 1.020 | |||||||||||||||||||||||||||
| Netherlands | 26.5%* | 0.863 | |||||||||||||||||||||||||||
| Panama | 7.5% | 0.940 | |||||||||||||||||||||||||||
| Poland | 12.5% | 0.997 | |||||||||||||||||||||||||||
| Slovakia | 15.0% | 0.860 | |||||||||||||||||||||||||||
| Sweden | 16.5% | 1.020 | |||||||||||||||||||||||||||
| Thailand | 5.0% | 0.957 | |||||||||||||||||||||||||||
| UAE | 3.0% | 0.980 |
*A substantial increase between 2015 and 2016 may account for the disproportionate average
These 10 countries range in development levels and geography; and have Female/Male Opportunity-Driven TEA ratios below and above 1. These differences suggest that the ascent of female entrepreneurs can occur anywhere.
For more analysis of female entrepreneurship, please consult GEM’s 2016/2017 Women’s Entrepreneurship Report, which received input from 65 total teams.
Analysis by Forrest Wright (GEM Global Data Team)

